


PixelPoint Bridge
- home
- Apps
- PixelPoint Bridge
- User Interface
User Interface
The user interface for PixelPoint Bridge provides basic diagnostic information about your connection. It also provides a link to the logs of the latest HubRise requests sent to the EPOS.
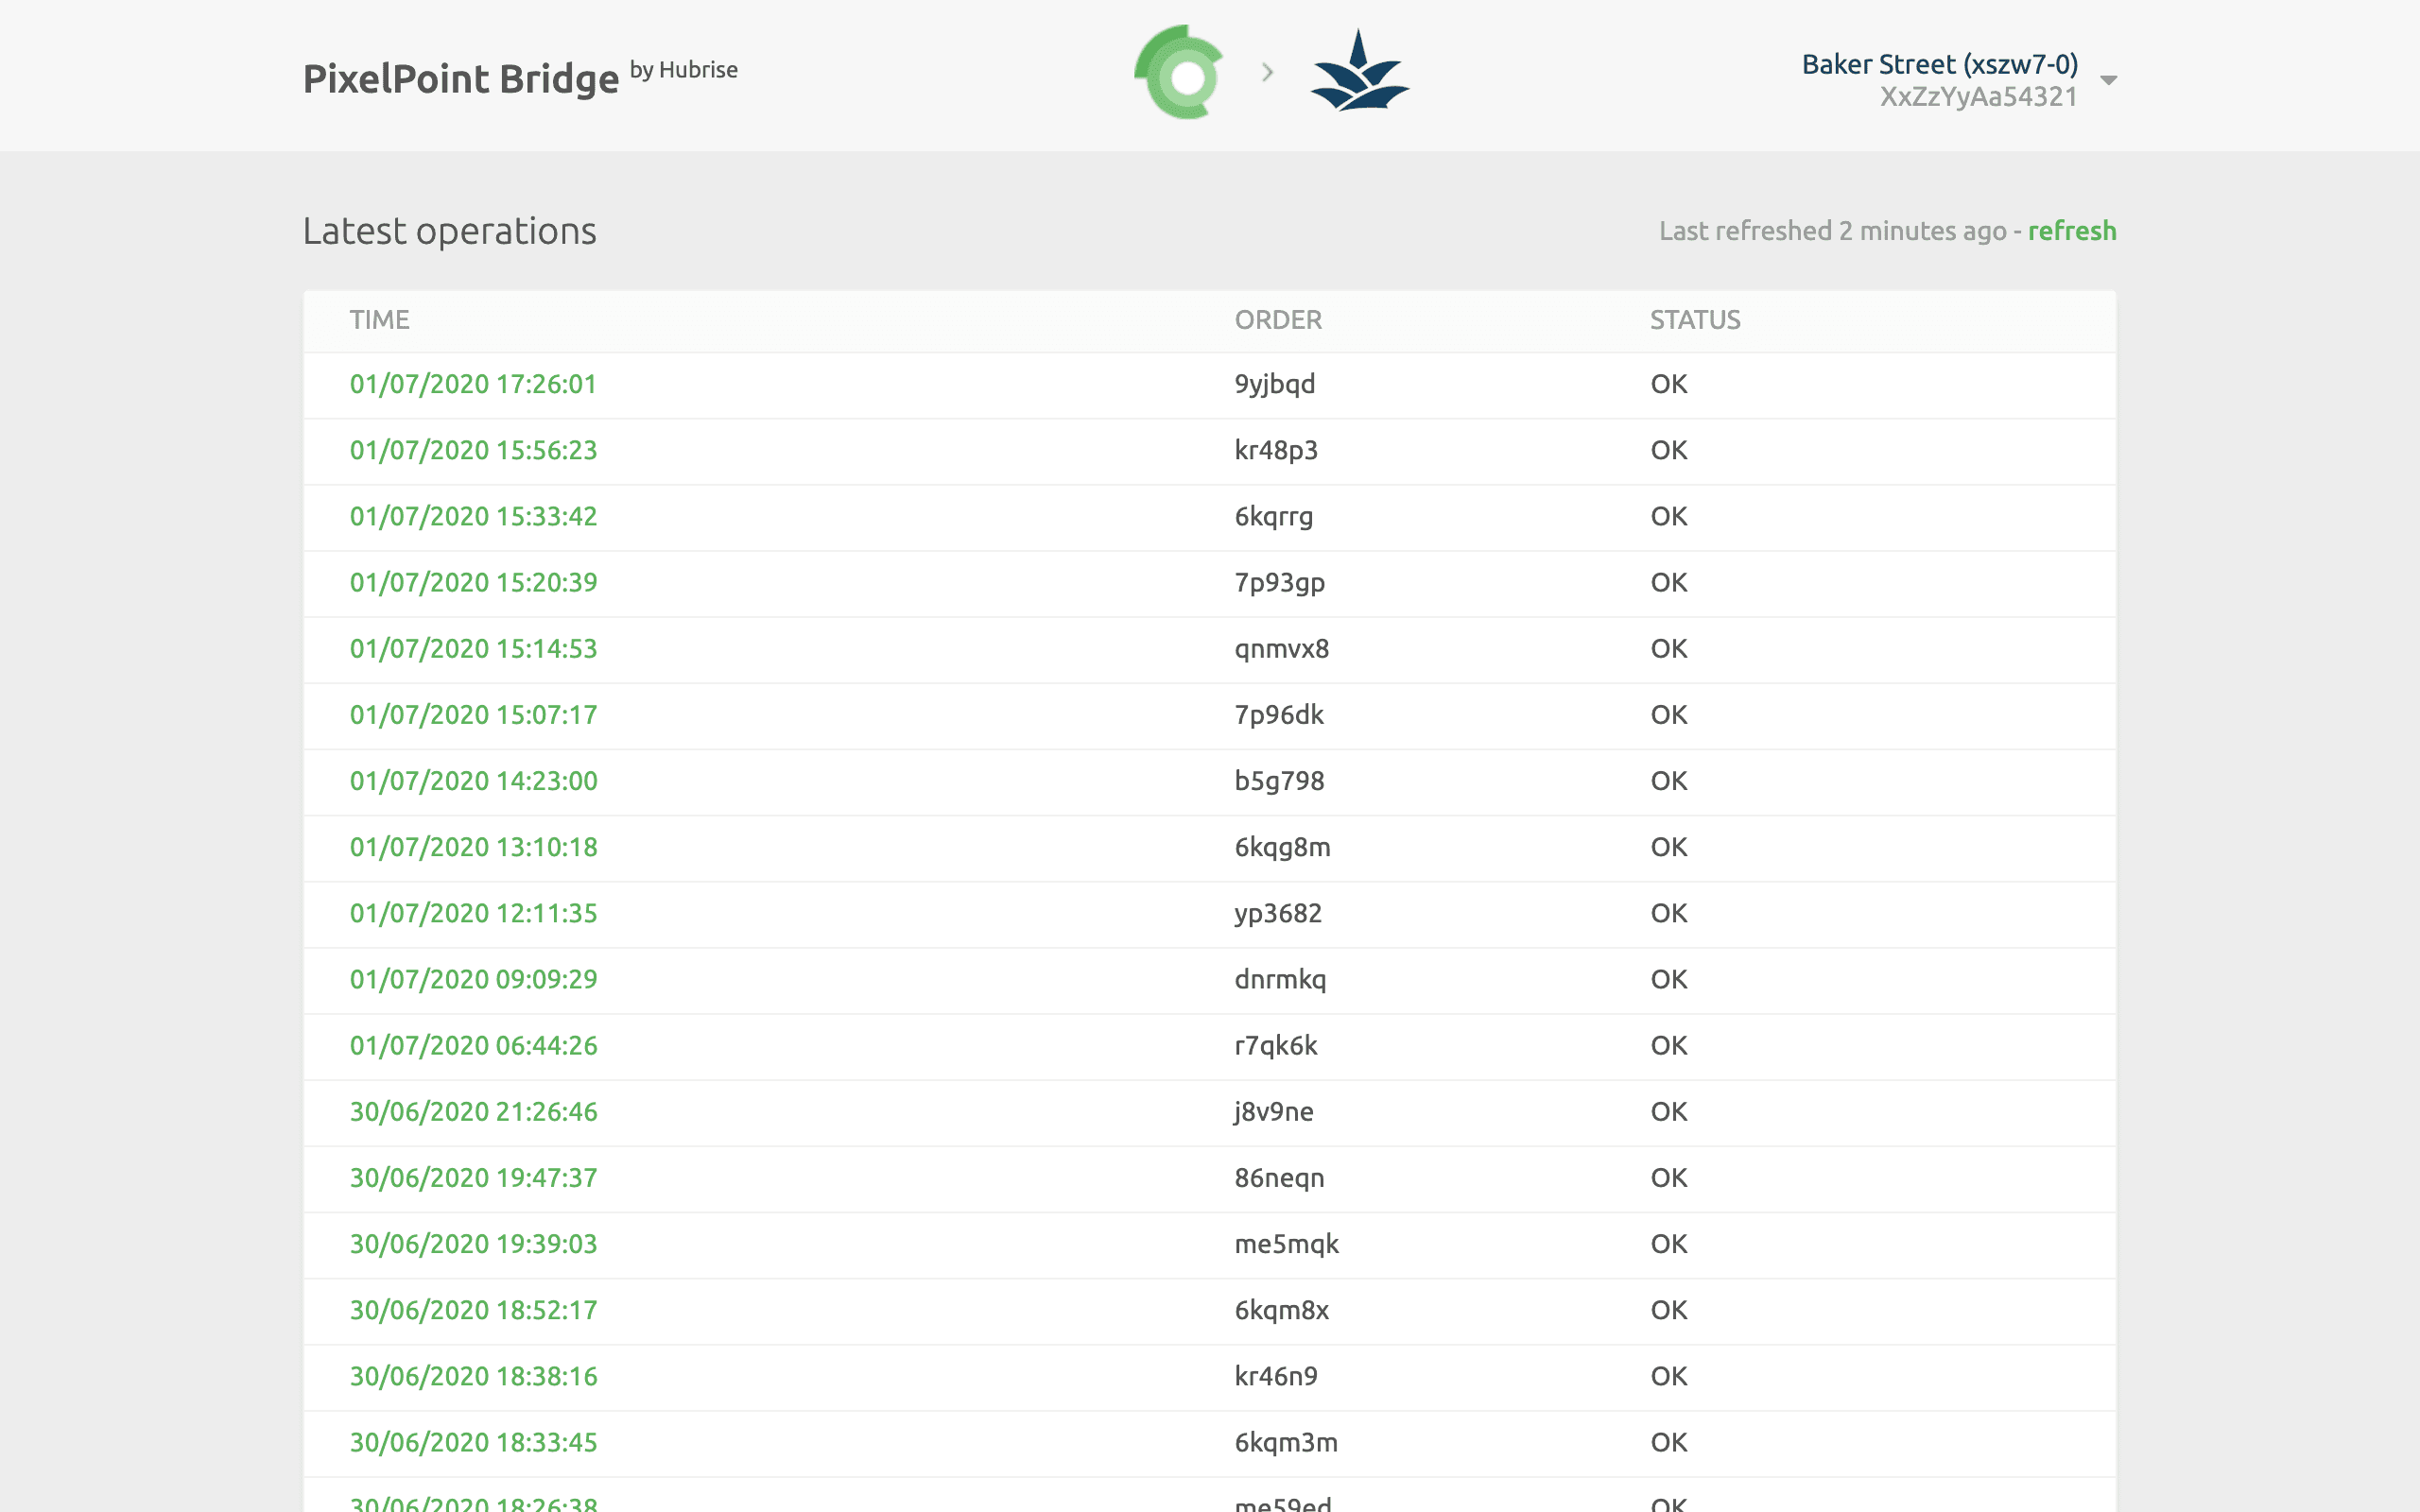
Main Page
The main page of PixelPoint Bridge displays the latest received orders. Each row shows:
- TIME: The date and time of the order.
- ORDER: The HubRise order ID.
- DESCRIPTION: An optional description for operations that are not related to a specific order. It could be empty, or inform of a specific action such as
System requestorCatalog push. - STATUS: The status of the order. The value
OKindicates that the order has been successfully sent, otherwise an error code will be displayed in red.
Clicking on an order will open a new page displaying all the information about it.
On the top right corner of the PixelPoint Bridge main page, the HubRise user and location connected are displayed, together with the API token currently used. Clicking the down arrow ![]() expands a menu where it is possible to change the language of the interface and to access the Configuration page.
expands a menu where it is possible to change the language of the interface and to access the Configuration page.
IMPORTANT NOTE: The first time you access the logs from PixelPoint Bridge, you will be asked to Allow the Bridge to access the information on your HubRise account.
Order Page
Selecting an order from the list will display all the logs of the API requests exchanged between HubRise and the PixelPoint EPOS via PixelPoint Bridge.
Requests are ordered with the latest on top, and each of them displays the following information:
- Time: The date and time the order was placed.
- Direction: The apps sending and receiving the request, in the format Origin → Destination.
- Endpoint: The status of the request. The value
OKindicates that the request has been successfully received, otherwise a message will explain the type of error occurred.
Clicking on a request will expand it to reveal the detailed logs of the request and its response.
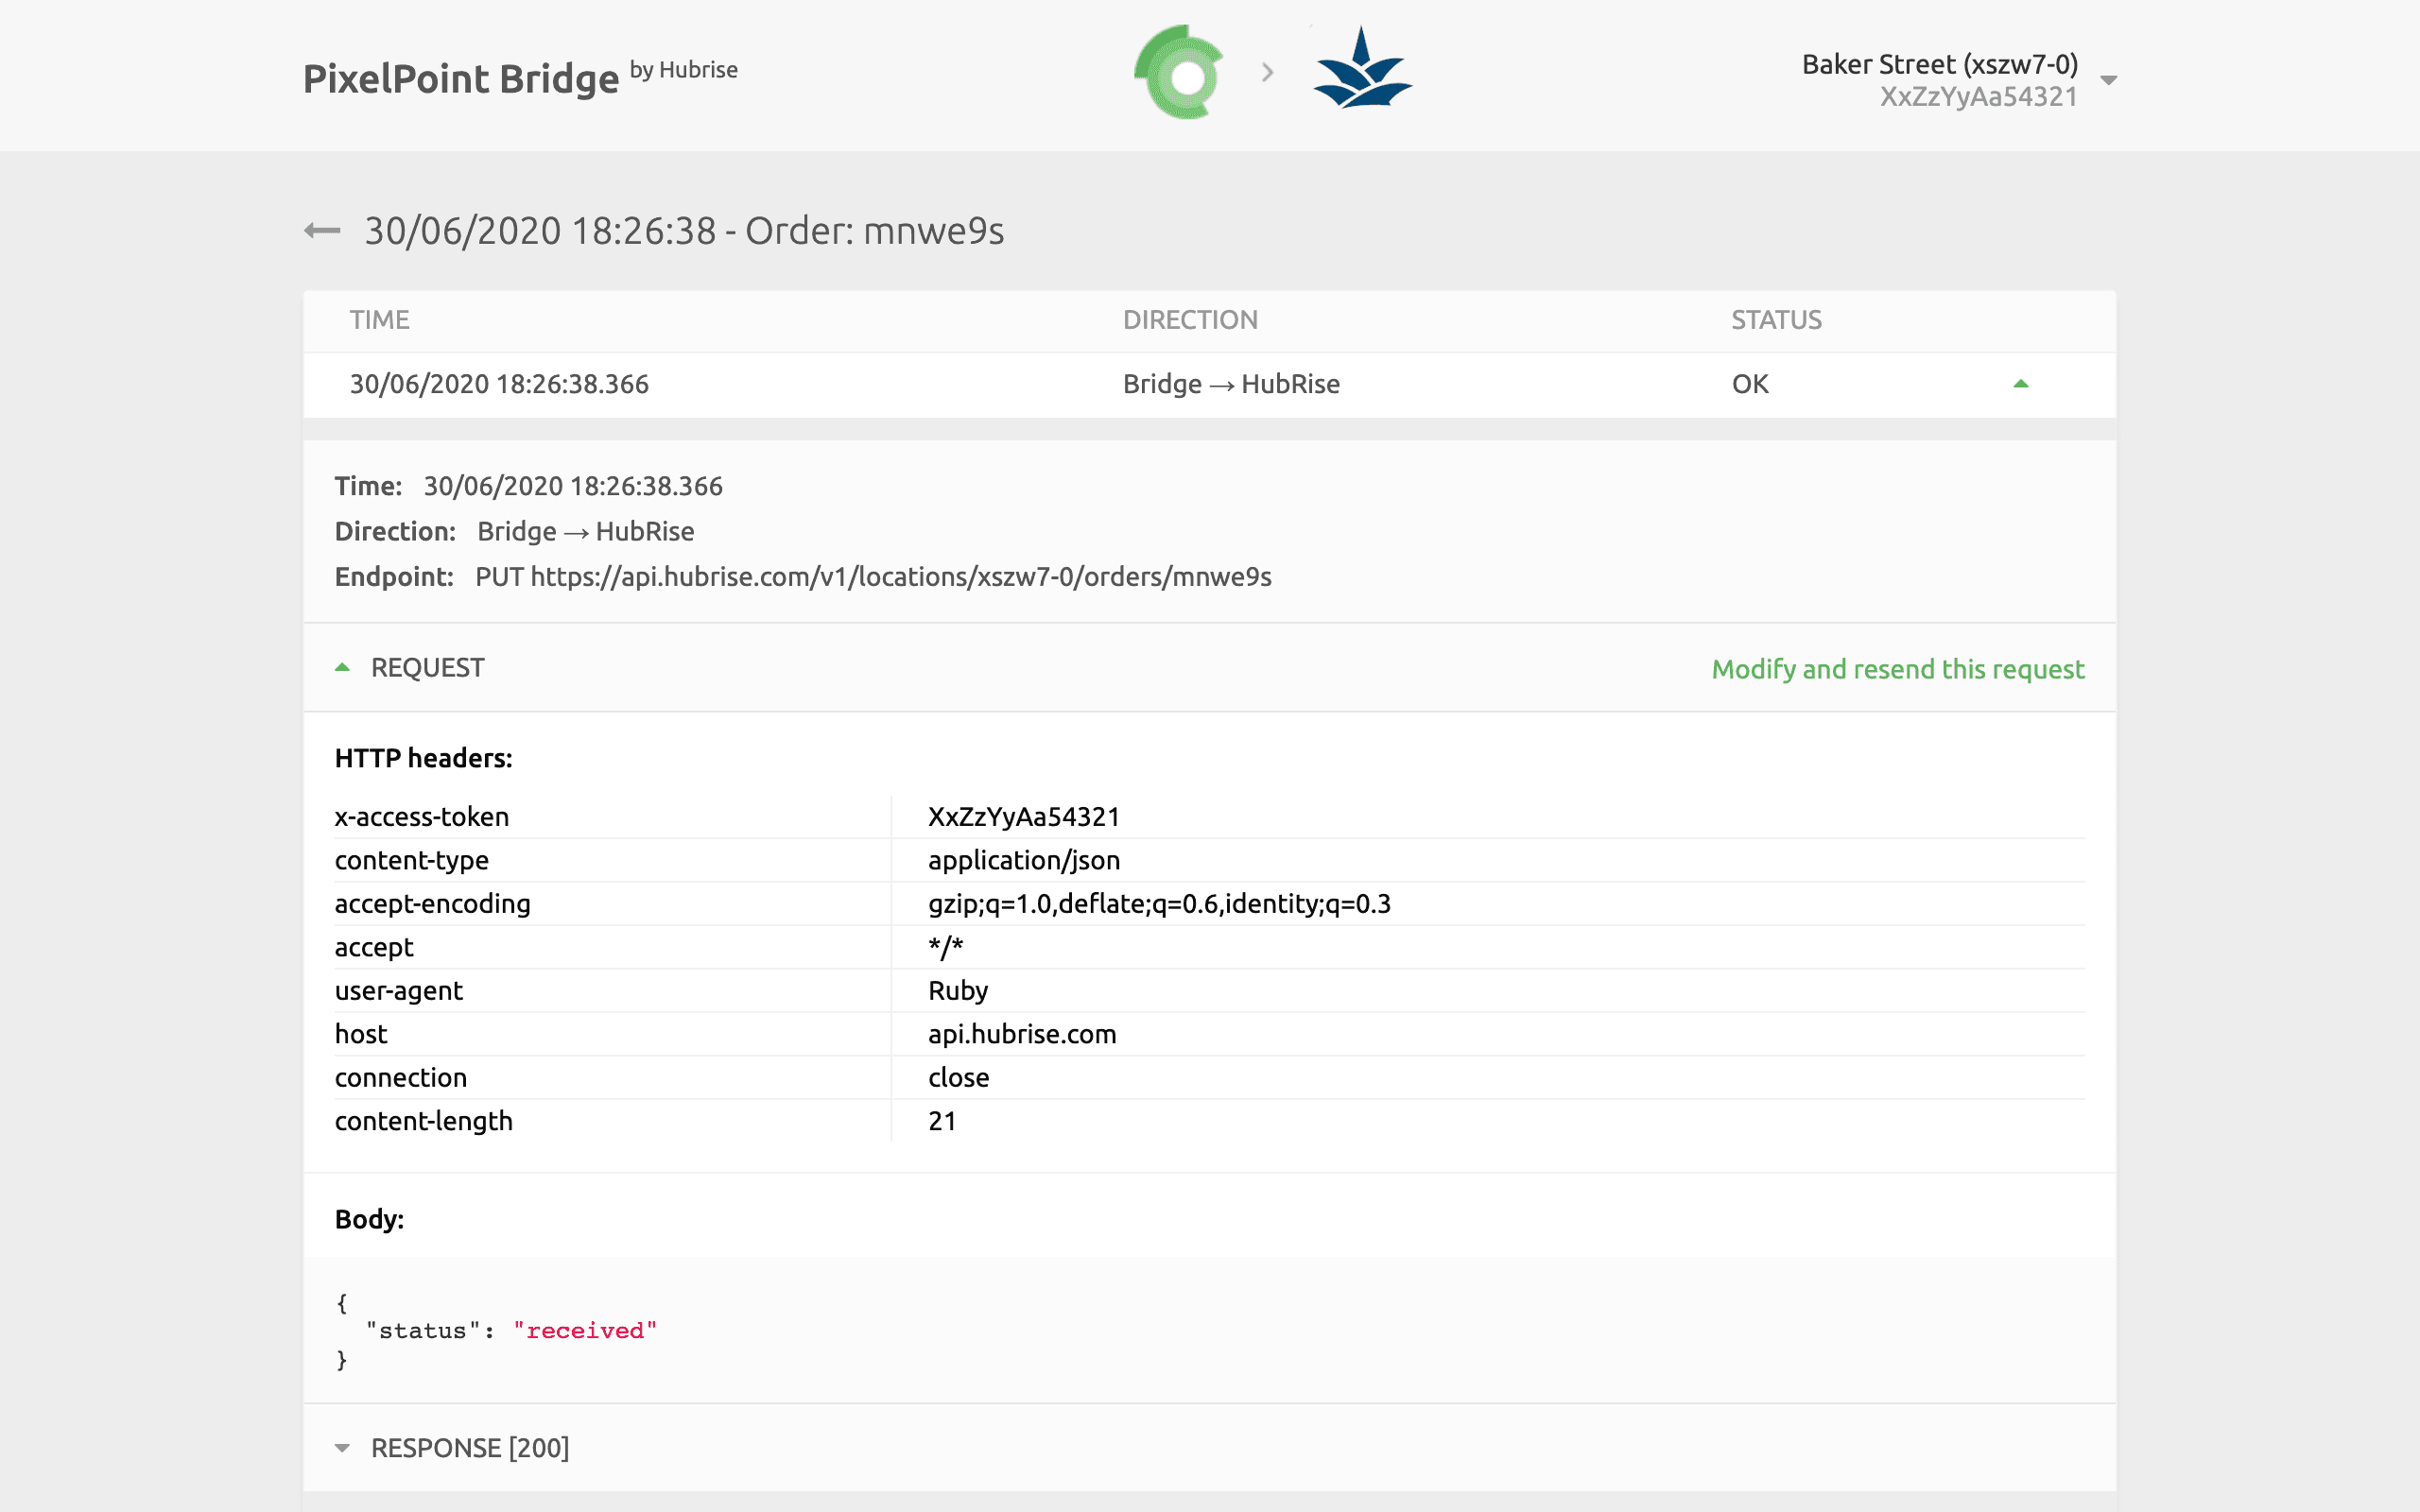
A detailed description of the logs can be found in Understanding Logs.
Configuration
To access the PixelPoint Bridge Configuration page, click on the arrow ![]() in the top right corner of the page to expand the menu, then click Configuration.
in the top right corner of the page to expand the menu, then click Configuration.
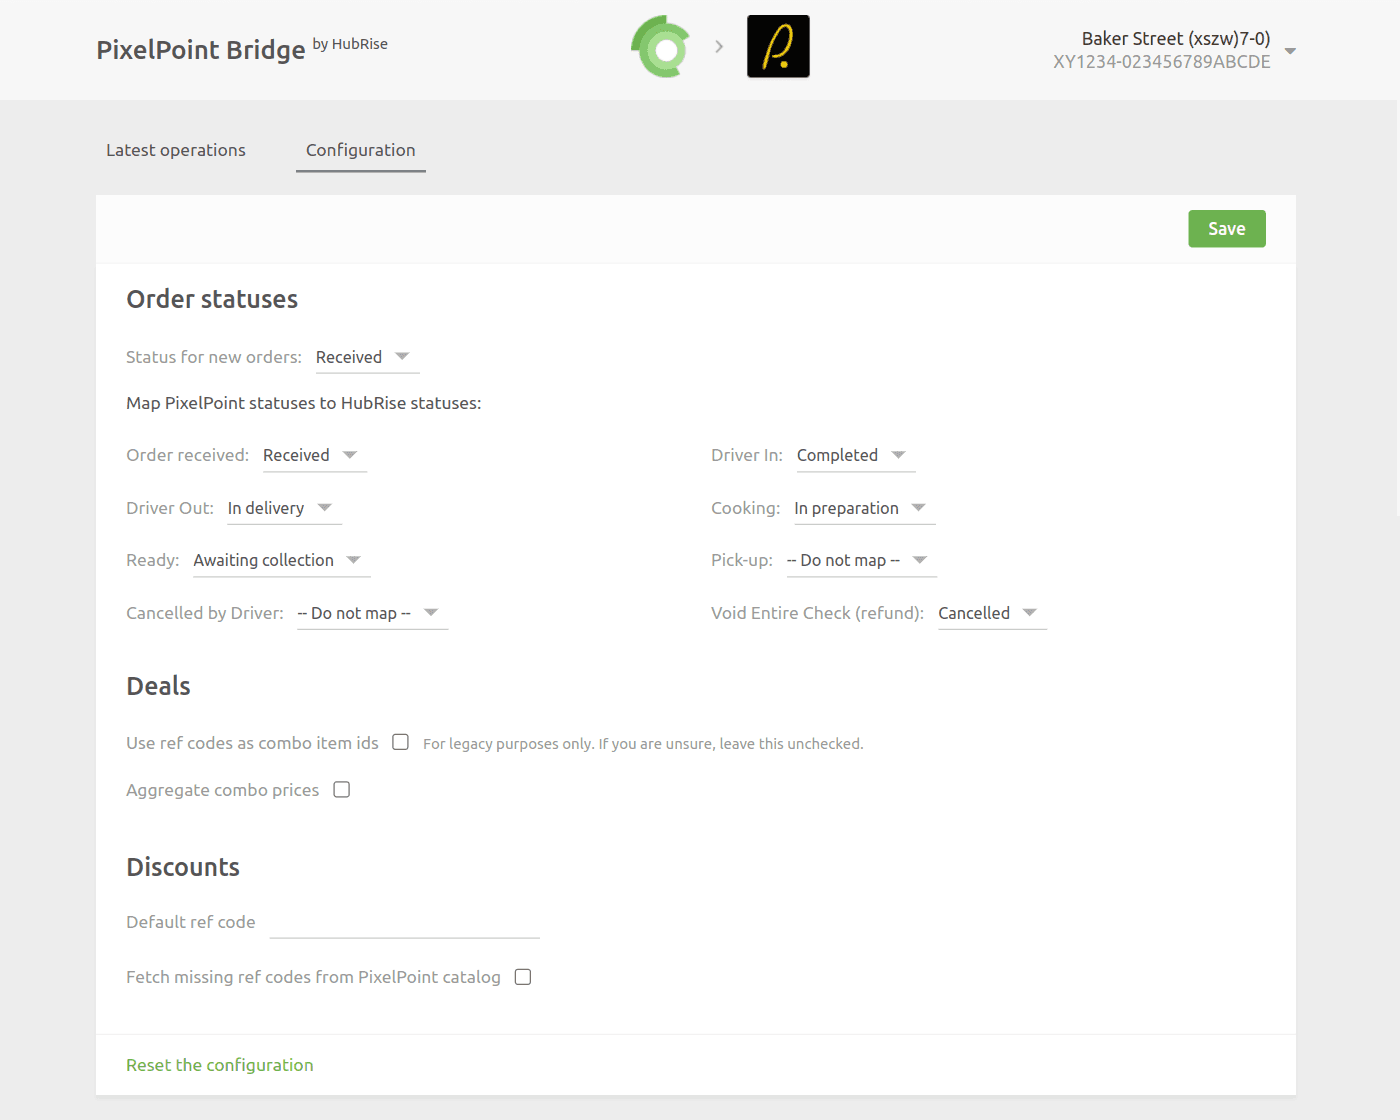
From this page, you will be able to customise the behaviour of PixelPoint Bridge. For more details, see Configuration.
Language and Navigation
In the top right corner of the screen, you can click on the arrow ![]() to expand the menu. From there, you can change the language of the page to English or French.
to expand the menu. From there, you can change the language of the page to English or French.
Clicking on the PixelPoint and HubRise logos on top of any page of PixelPoint Bridge will bring you back to the Latest Operations page.